Charting Interaction Graphs: How Overlay Tools Track and Enhance Participation Rates in Live Cooperative Matches
Ulrich Keller · May 24, 2026
Charting Interaction Graphs: How Overlay Tools Track and Enhance Participation Rates in Live Cooperative Matches
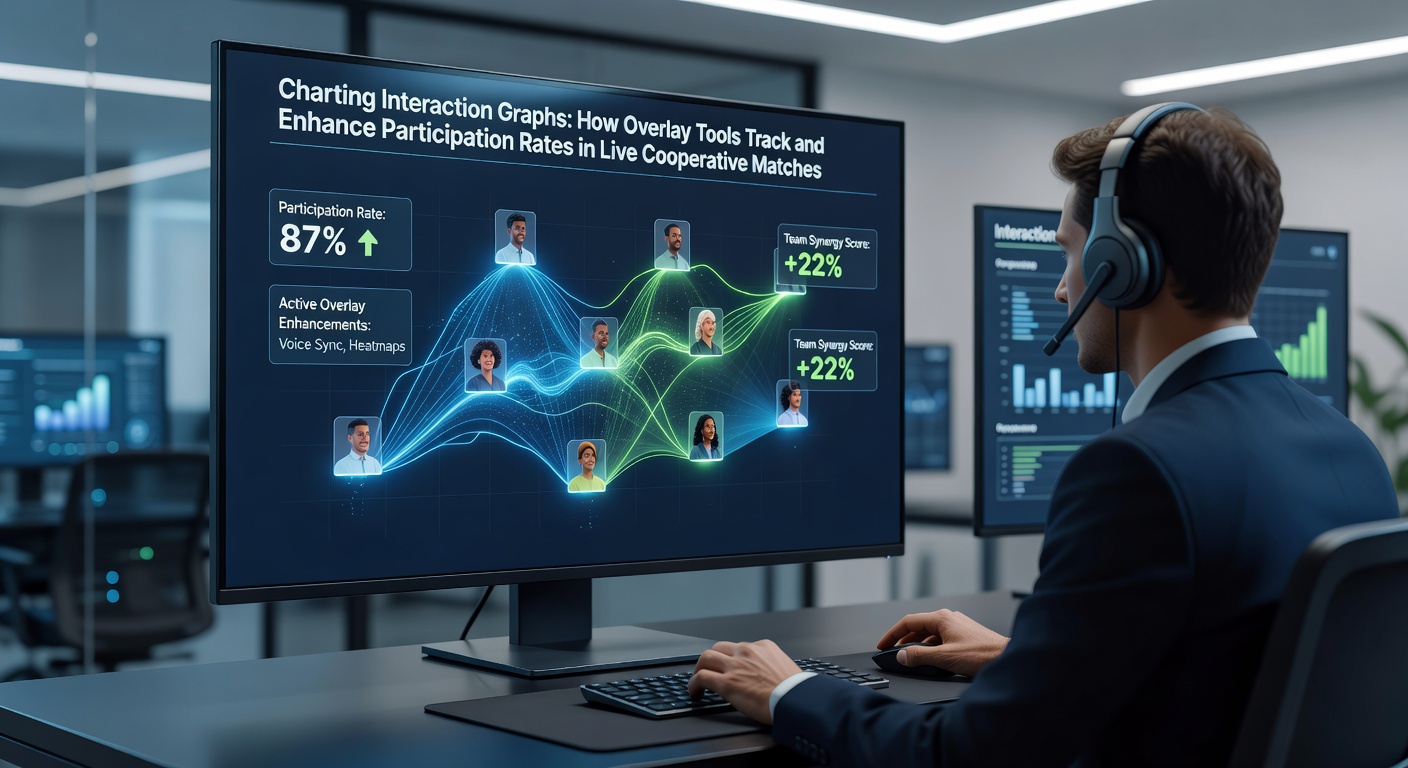
Live cooperative matches draw large audiences who engage through chats, reactions, and collaborative actions, and overlay tools now map these exchanges into interaction graphs that reveal participation patterns in real time. Developers integrate these overlays directly into streaming platforms so that metrics such as message volume, emoji frequency, and team-sync events appear alongside gameplay footage without interrupting the broadcast flow. Observers note that the graphs update continuously, turning scattered viewer inputs into clear visual trends that streamers and production teams review during the match itself.
How Overlay Systems Capture Data Streams
Overlay applications pull information from multiple sources including chat APIs, donation trackers, and in-game telemetry feeds, then compile the numbers into line charts, heat maps, and bar graphs that update every few seconds. Programmers configure these tools to recognize keywords tied to cooperative strategies so that spikes in discussion about shared objectives register as distinct peaks on the graph. In May 2026 several platforms introduced updated APIs that allow overlays to pull participation data from both the streaming service and the game client simultaneously, giving producers a combined view of audience and player activity.
Visualizing Participation Trends During Matches
Once the data reaches the overlay engine it converts raw counts into time-stamped visuals that appear in a corner of the stream or on a secondary screen used by commentators. Viewers see their collective activity represented as rising or falling lines, which often prompts additional messages when the graph shows a dip in engagement. Researchers at several universities have documented how these immediate visual cues correlate with measurable increases in chat activity within cooperative titles where team coordination forms the core loop.
Data from the Entertainment Software Association indicates that streams incorporating live interaction graphs maintain higher average concurrent chat users throughout extended cooperative sessions compared with broadcasts that rely on static overlays alone. The graphs also segment participation by source, separating Twitch chat from Discord voice reactions or in-game emotes so that producers can identify which channel drives the strongest response at any given moment.
Adjusting Broadcast Elements Based on Graph Insights
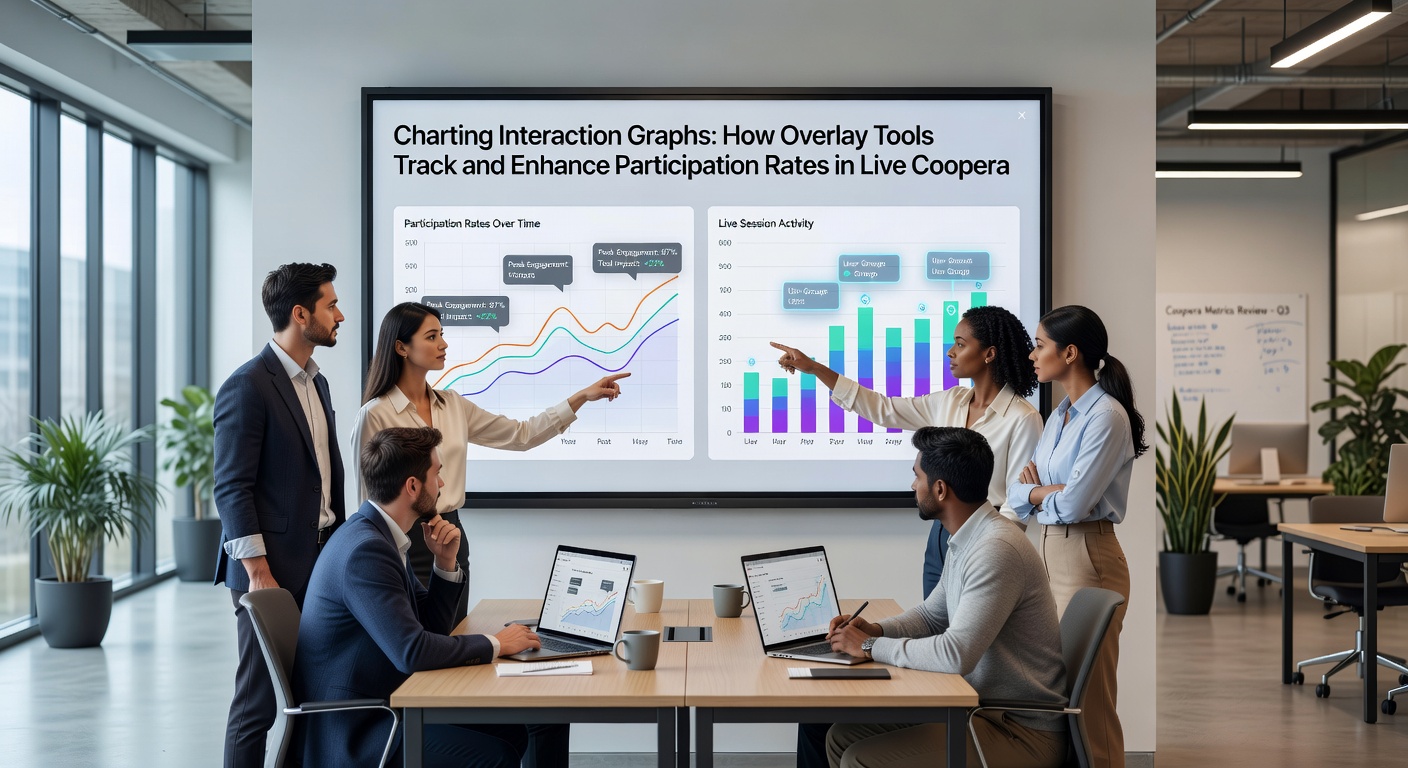
Production teams monitor the graphs and adjust camera angles, commentator prompts, or on-screen prompts when participation lines flatten. A sudden drop in cooperative discussion might trigger a shift to a wider shot that shows all team members, prompting viewers to comment on positioning or resource allocation. Streamers who review post-match graph exports often schedule future cooperative events around the time slots where previous graphs showed sustained high engagement, creating a feedback loop that refines scheduling without relying on subjective impressions.
Figures released by the Interactive Games and Entertainment Association reveal that titles supporting real-time graph overlays experienced an average 18 percent rise in repeat viewership across cooperative tournament circuits during the first quarter of 2026. The data also shows that smaller production crews benefit most because the automated graphs replace manual chat monitoring and free staff to focus on game capture and audio mixing.
Case Examples from Recent Cooperative Events
One European tournament series integrated overlay graphs that highlighted viewer-suggested strategies during matches, resulting in visible spikes whenever the on-screen line climbed after a suggestion appeared. Australian broadcast teams adopted similar systems for local cooperative leagues and reported that graph visibility encouraged viewers to form temporary chat alliances that coordinated in-game actions across separate player squads. These examples illustrate how the same technical layer adapts across regions and event scales while maintaining a consistent method of tracking participation.
Technical Requirements and Integration Steps
Setting up an interaction-graph overlay begins with connecting the streaming software to the chosen graph engine through secure API keys, followed by mapping specific chat commands or emote sets to graph categories. Most engines allow customization of color schemes and update intervals so that graphs remain legible on both desktop and mobile viewers. Compatibility checks ensure the overlay does not exceed bandwidth limits, particularly during cooperative matches that already transmit multiple player perspectives simultaneously.
Conclusion
Overlay tools that generate interaction graphs now form a standard component of live cooperative match coverage by converting viewer activity into measurable visuals that both audiences and producers reference throughout the event. Continued API refinements and cross-platform data sharing point toward broader adoption across additional cooperative formats in the coming cycles.