Tracing Data Pathways from Hardware Sensors to Live Audience Metrics in Online Competitive Play Sessions
Greta Schmidt · Jul 28, 2026
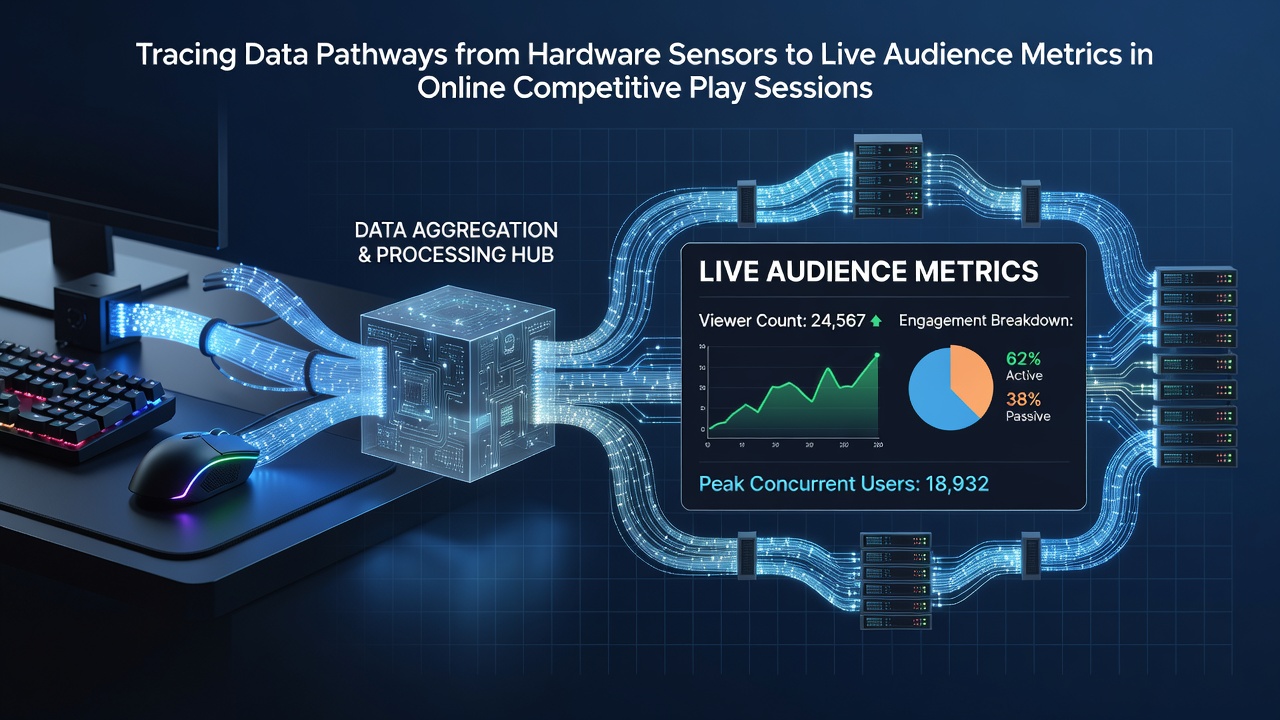
Tracing Data Pathways from Hardware Sensors to Live Audience Metrics in Online Competitive Play Sessions
Hardware sensors embedded in controllers, wearables, and system components capture raw inputs such as motion data, biometric readings, and performance metrics during online competitive play sessions, after which these signals travel through layered processing stages before reaching audience-facing displays. Researchers at institutions like the University of California have documented how these pathways operate in real time, with data packets moving from local devices to centralized servers that aggregate viewer engagement statistics. According to a 2025 industry report from the European Gaming Technology Alliance, sensor outputs now integrate directly with streaming platforms to generate live metrics on participation rates and interaction patterns.
Initial Data Capture at the Hardware Level
Controllers equipped with accelerometers and gyroscopes record player movements at millisecond intervals, while wearable devices track heart rate variability and skin conductance that reflect stress levels during high-stakes matches. System sensors monitor GPU temperatures, frame rates, and network latency, creating a continuous stream of performance indicators that teams analyze for optimization. These raw readings undergo initial filtering on the device itself to reduce noise before transmission, ensuring that only relevant signals proceed along the pathway. Data shows that in sessions involving thousands of concurrent players, this capture phase generates gigabytes of information per minute, which then routes through wired or wireless connections to local processing units.
Transmission and Aggregation Stages
Once captured, the information travels via network protocols to cloud-based aggregation points where algorithms correlate sensor inputs with game events and viewer behaviors. Studies from the Australian Centre for Digital Innovation reveal that synchronization occurs within 200 milliseconds on average, allowing metrics to update without noticeable delay for audiences. Custom middleware merges these streams with chat logs and poll results, producing composite datasets that platforms use to display overlays such as predicted win probabilities or engagement heatmaps. But here's the thing: transmission bottlenecks arise when multiple sensors compete for bandwidth, prompting developers to implement priority queuing that favors biometric data over environmental readings during critical moments.
Integration with Audience Metrics Systems
Processed data feeds into analytics engines that calculate live audience metrics, including average view duration, chat sentiment scores, and click-through rates on interactive elements. These calculations draw from both player sensor outputs and viewer-side inputs collected through platform APIs, creating feedback loops that adjust stream parameters dynamically. Figures from a July 2026 analysis by the Canadian Digital Media Research Consortium indicate that such integrations have increased metric accuracy by correlating wearable stress indicators with spikes in viewer retention during tournament finals. Observers note that this stage often employs machine learning models trained on historical session data to forecast audience responses before they fully materialize in real time.
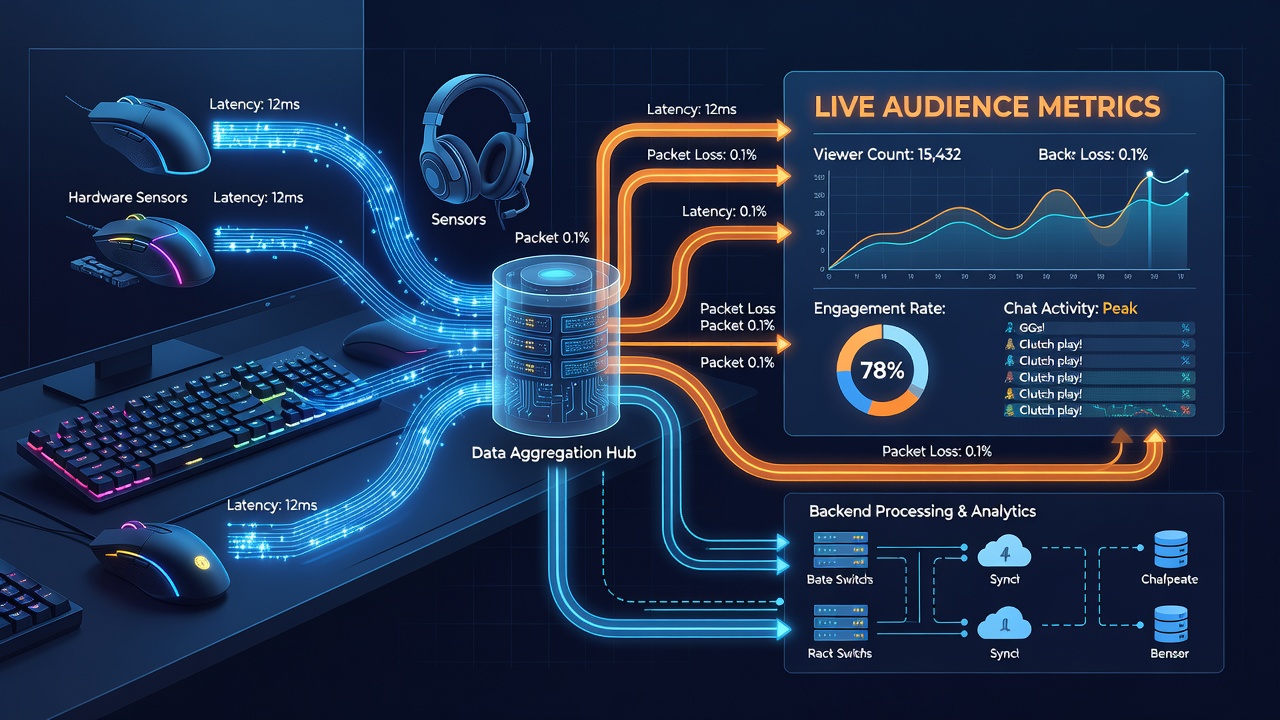
Real-Time Delivery and Visualization
Final metrics appear on stream overlays and separate dashboards that audiences access through companion apps or embedded interfaces, with updates occurring at frequencies that match the pace of competitive matches. Researchers have observed that visualization tools prioritize clarity by grouping related data points, such as combining controller input patterns with biometric trends to highlight moments of peak tension. Transmission continues uninterrupted because redundant pathways route information through backup servers when primary connections experience congestion. Those who've examined these systems in detail know that the entire pathway from sensor to metric display completes in under one second in optimized setups, supporting the demands of large-scale events.
Security and Compliance Considerations
Throughout the pathway, encryption protocols protect sensitive biometric information while compliance frameworks govern data retention and sharing practices across international jurisdictions. Industry organizations track how platforms anonymize player and viewer data before aggregation, reducing risks associated with unauthorized access. Data indicates that regulatory updates effective in mid-2026 have standardized reporting requirements for sensor-derived metrics in competitive environments, prompting developers to audit their transmission chains regularly. This process ensures that audience metrics remain reliable without exposing underlying raw sensor readings to external parties.
Conclusion
The complete pathway from hardware sensors to live audience metrics relies on coordinated stages of capture, transmission, aggregation, and visualization that operate continuously during online competitive play sessions. Evidence from multiple research sources confirms that these systems deliver synchronized information streams capable of supporting both player performance analysis and viewer engagement tracking. As network infrastructures advance, the pathways continue to shorten in latency while expanding in the volume of data they handle, maintaining factual accuracy in the metrics presented to audiences worldwide.